
Ticket detail
The ticket detail page at /tickets/:id is where the work happens. It puts the screenshot, the walkthrough clip, the DevTools data, the comments, and the metadata in one place so you (or an AI agent) can debug end to end without leaving the page.
Layout
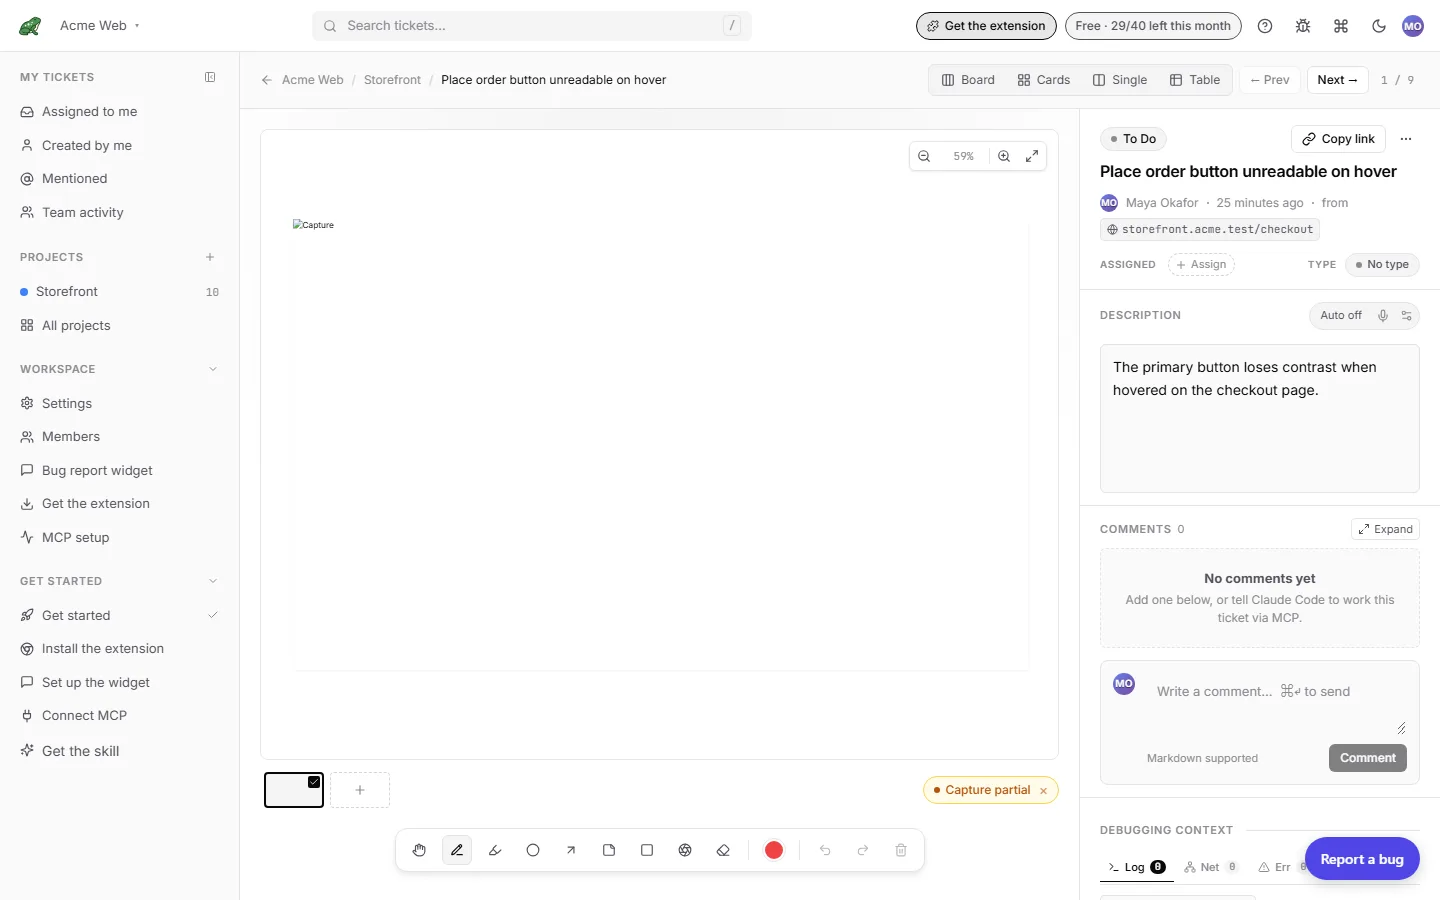
Two regions, roughly 80 / 20.
Main region (left). The screenshot with the annotation toolbar above it. On a walkthrough ticket the clip is a tile of its own in the image row, just after the screenshot, and plays where the screenshot would otherwise be. Drag and drop additional images onto this region to attach extras (mobile view, design reference, follow-up screenshot). Each attachment gets the same annotation tools.
Side region (right). Top to bottom: the column pill, the action buttons, the title, the creator or reporter line, the Assigned row, the Description, the DevTools tabs, and the comments.
Actions at the top
| Control | What it does |
|---|---|
| Column pill | Click to move the ticket to another column. |
| More > Send to Jira | Available when the plan and project mapping allow it. See Jira integration. |
| Copy link | Copies a direct URL to this ticket. |
| More menu | Duplicate, Move to project…, Set branch name…, Download capture as ZIP, Archive, Delete…. |
Delete… is permanent and removes the capture and attachments. Archive is reversible from the archive view.
Title
Click the title to edit it. It saves when you click away.
While Toado’s title writer runs, the title field is blank rather than filled with a placeholder. Within a few seconds a descriptive title arrives (for example “404 on /api/users in checkout flow”). If you start typing before it does, your text wins. When nothing is being written, because AI is off for the workspace or the writer finished without a title, the field reads Untitled ticket instead. The pins panel in the extension uses Untitled pin for the same state, since what it lists are pins rather than ticket pages.
Who filed it, and from where
The line under the title says who created the ticket and, when it is not an extension capture, a source badge saying how. Hover the badge for a one-line explanation.
| Badge | source value | Meaning |
|---|---|---|
| Extension | extension | Captured with the Toado browser extension by a team member. No badge is shown for this default case. |
| Widget | widget | Sent by a visitor through the report widget embedded on your site. |
| Report link | public_link | Sent through your shareable Toado report page. |
| Team snippet | team_snippet | Captured by a signed-in team member through the embedded snippet. |
| AI agent | mcp | Created by an AI agent over MCP. |
| Manual | manual | Typed directly into Toado. |
| Walkthrough | recording | Created from a narrated Toado walkthrough recording. |
For Widget and Report link tickets the creator line shows the reporter’s self-reported name or email (or “Anonymous reporter”) with an unverified tag, because no confirmation email was sent. The workspace member recorded as creator is a stand-in and is not shown.
After the creator you see how long ago the ticket was created, a from chip with the source page’s host and path (click to copy the full URL), and a branch chip once a branch name is set (click to copy).
Capture mode
Every capture-producing ticket also records a captureMode, which says how the capture was taken rather than who took it.
captureMode | Meaning |
|---|---|
pin | Placed on a specific element from the pins panel, or by Alt+click during a walkthrough. Carries an element block and a page identity. |
classic | A whole-page capture: Alt+C with in-page logging off, the Capture button, or a walkthrough segment with no pin. |
widget | Any widget, report link, or team snippet submission. |
edit, markup | In-page edit and markup captures from the extension. |
Manual and MCP-created tickets have no capture mode. The value is on the ticket record and in get_ticket; the page does not render it as a label.
The element block
A pin ticket knows which element was picked. The pins panel uses it to put the marker back on the page, and get_ticket returns it as element so an agent can find the thing in the source instead of guessing from the screenshot.
| Field | What it is |
|---|---|
selector | A CSS selector for the element. Present only when locatable is true. |
locatable | Whether the element can be found again by selector. When false, the element was recorded without a usable selector and the remaining identity is what you have. |
tag | The HTML tag. |
id | The element’s id, when it had one. |
classes | Its class names, omitted when empty. |
testId | data-testid, data-test, or data-cy, whichever the element carried. |
ariaLabel | Its aria-label. |
text | A short piece of the element’s own text, redacted at capture time. |
componentName | The React or Vue component that rendered it, when detectable. |
Geometry (where it sat on one person’s screen) is deliberately not part of the block. A click on an element that cannot be tracked anchors to its nearest trackable ancestor, and the marker still lands where you clicked.
The ticket page does not yet show these fields as their own panel; read them through the get_ticket tool.
Page identity
A pin ticket also stores a pageIdentity: the origin plus the path of the page the pin was placed on, with the query string and the fragment stripped. So a pin placed on https://shop.test/cart?step=2#totals has the page identity https://shop.test/cart, and every pin on that path is found together whatever the query says. This is what the extension matches when it decides which pins to show on the page in front of you. It is separate from the source URL, which is the full address at capture time, and it is only set for pins.
Walkthrough clip
A ticket created from a walkthrough carries the seconds of screen and narration that produced it. It appears as a tile of its own in the image row, just after the screenshot: the still the pin was placed on, with a play mark and Watch this moment beside it. Choose it and the clip plays where the screenshot would otherwise be, laid over the annotation canvas, so nothing you were part-way through drawing is lost. An audio-only walkthrough reads Hear this moment and plays in a bar across the foot of the image, which stays in view, since the screenshot is the only picture there is.
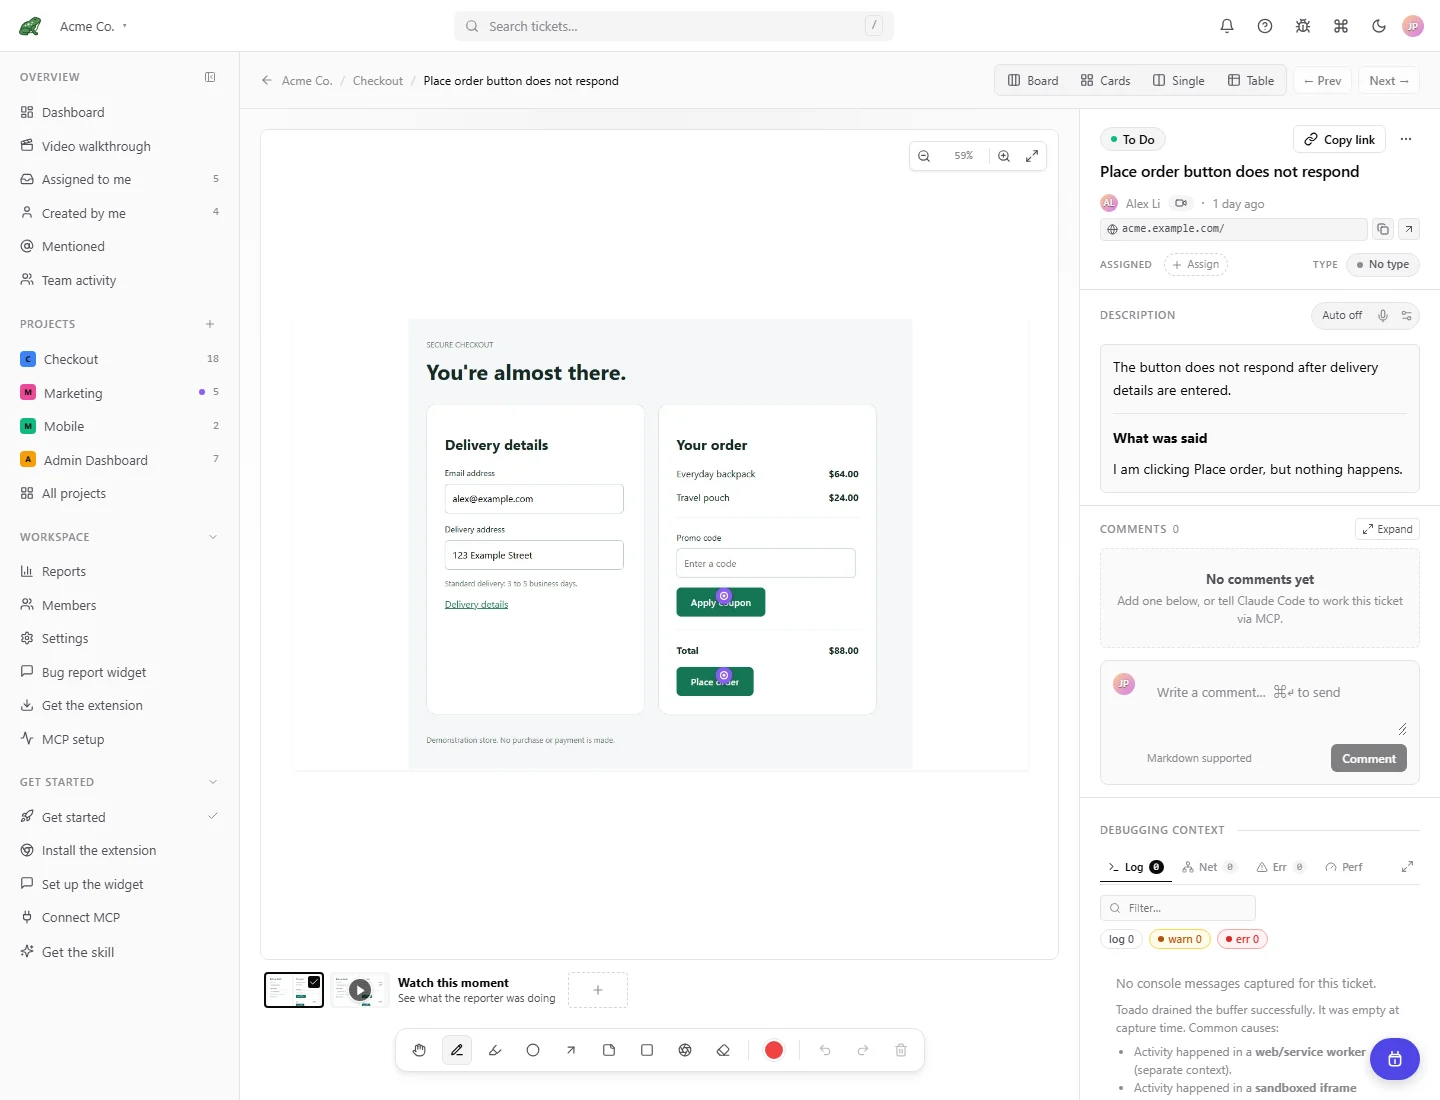
Local demonstration data. Select the image to view the full interface.
The clip loads only when you press play, so opening a ticket does not download video you did not ask for.
When the clip has expired
Walkthrough video has a plan-configured retention period. Once a clip expires, the image row shows an expiry notice; the ticket, description, and transcript remain unless deleted separately. Free workspaces may see an upgrade prompt, while paid workspaces see an expiry notice. Check the workspace’s displayed allowance instead of assuming a fixed number of days. See Data retention for media and deletion details.
Description
Markdown is supported (headings, lists, links, code blocks, inline code). Click into the field to edit. The description autosaves 1.5 seconds after your last keystroke, when you click away, and when you close the tab. The description is what an AI agent reads via get_ticket, so detail here pays dividends.
The mic button next to the Description label dictates into the field using the browser’s speech recognition.
Interpreted description with the transcript underneath
On a walkthrough ticket the description has two parts. The top is Toado’s interpretation of what you said, written as a bug report a developer can read. Below a divider headed What was said is the verbatim transcript, untouched. The interpretation is what you read; the transcript is the record that proves it, so if the model heard “full width” as “full height”, the words are still there. You can edit the interpretation above the divider and the transcript stays put.
Short narration (a few words) is not interpreted and the transcript stands alone.
Save & return and Mark ready
When you arrive from a fresh extension capture, the Save & return (⌘/Ctrl+Enter) button saves the title and description, marks the ticket ready, and sends you back to the tab you captured from. Until then a classic capture is a draft and is hidden from the board. A draft you open later shows Mark ready instead.
Capture health
If any capture category came back partial or empty, a pill appears on the image row: Capture partial (yellow) or Capture failed (red). Hover for the reason, for example console capture blocked by CSP, or a walkthrough whose transcript failed while the video was fine. Dismiss it with the X. The same information is on the ticket for agents reading via MCP, so both know the capture is incomplete before debugging starts.
DevTools panel
Four tabs show the captured DevTools state:
- Console: every captured
console.*call with level (log, info, warn, error, debug), serialized arguments, timestamp, and stack trace. - Network: each request with method, URL, status, timing, headers, response size, and (where available) response body.
- Errors: uncaught errors and unhandled promise rejections with stack traces.
- Performance: navigation timing, long tasks, key Web Vitals (LCP, CLS, FID).
Each tab supports text-filter search. Filtering is local; it does not re-fetch from the server. Whether the Network tab has request and response bodies depends on two things: Deep network capture for this site has to have been on in the extension when the capture was taken, and the capture profile for the origin must not strip them.
See DevTools panel for the full per-tab reference.
Comments
Chronological, oldest first. Each comment shows author, avatar, timestamp, and body (markdown).
Comments from MCP clients (for example Claude Code) are visually distinct. They carry an MCP badge and the author label includes both the user and the token name (for example “Jason (claude-code on macbook) via MCP”). This makes audit trails self-explanatory.
Add a comment with the input at the bottom. Cmd + Enter to submit.
Mention a teammate with @. They get a daily digest email if they have it turned on, and the ticket appears in their inbox under Mentioned. See Comments & mentions.
Metadata
| Field | What it is |
|---|---|
| Source URL | The page the capture was taken from, shown as the from chip. Click to copy. |
| Created | The capture timestamp, shown as relative time. |
| Created by / reporter | A workspace user for internal captures, or the reporter name or email supplied by an external reporter. |
| Assigned | Users currently assigned. Click Assign or the plus to add or remove. |
| Branch | Git branch the ticket is being worked on. Set by start_work_on_ticket from the MCP server, or from Set branch name…. |
| Resolved | A flag independent of column position. A resolved ticket stays on the board until archived. |
| Jira issue | Once exported, the issue key is a button that opens the issue in Jira. |
Keyboard shortcuts
| Action | Shortcut |
|---|---|
| Previous ticket in this project | [ |
| Next ticket in this project | ] |
| Submit a comment | Cmd + Enter |
| Save and return to source tab (after a fresh capture) | Cmd + Enter |
| Open the shortcut cheatsheet | ? |
| Close any modal or popover | Esc |
The save-and-return shortcut only fires when you reached the ticket via a fresh capture. Outside that flow it does nothing.
Full list: Reference › Keyboard shortcuts.
Jira and live-page anchors
The current Jira integration supports manual and optional automatic sends. With working webhooks, Jira Done and reopened states can move a linked Toado ticket; Toado type changes can update its mapped Jira issue type. General comments and assignees do not synchronize. Moving a marker in the screenshot annotation editor does not move the live-page anchor. See Advanced page pins.
Where to next
- Annotations for the structured-shape view of what users drew.
- DevTools panel for per-tab detail.
- Drafts for what happens to a capture you never finished.
- Jira export for sending a ticket to Jira with its images.