
Bug report widget
The Toado bug report widget adds a configurable reporting button to a product you control. Customers can report from the page where a problem happened without a Toado account or browser extension. Toado creates a ticket in the project you choose and attaches the available screenshot and browser evidence.
Every workspace can run the widget. There is no plan gate on the widget settings or on the public submission endpoint, but configuring one is owner-only. Each project has its own key, appearance, capture settings, allowed sites, and destination board.
External reporters never need a Toado account and never take a seat. Each report they send does create a ticket, and those tickets count towards the workspace’s monthly ticket allowance like any other. A workspace that has reached its allowance stops accepting reports, and the reporter is told that bug reporting is temporarily unavailable for the site.
Before you start
- A Toado workspace and a destination project.
- Owner access. Every widget setting and every widget API route is owner-only.
- Permission to add a script to the target site.
- A safe test page or staging environment.
If the site has a strict Content Security Policy (CSP), plan to merge the sources generated by Toado into its existing directives. A tag manager works only when the site’s CSP and loading rules permit it.
The loader needs fetch, promises, FormData, and shadow DOM. On a browser missing any of them it exits without rendering anything, so no launcher appears and the host page is untouched.
Choose where to start
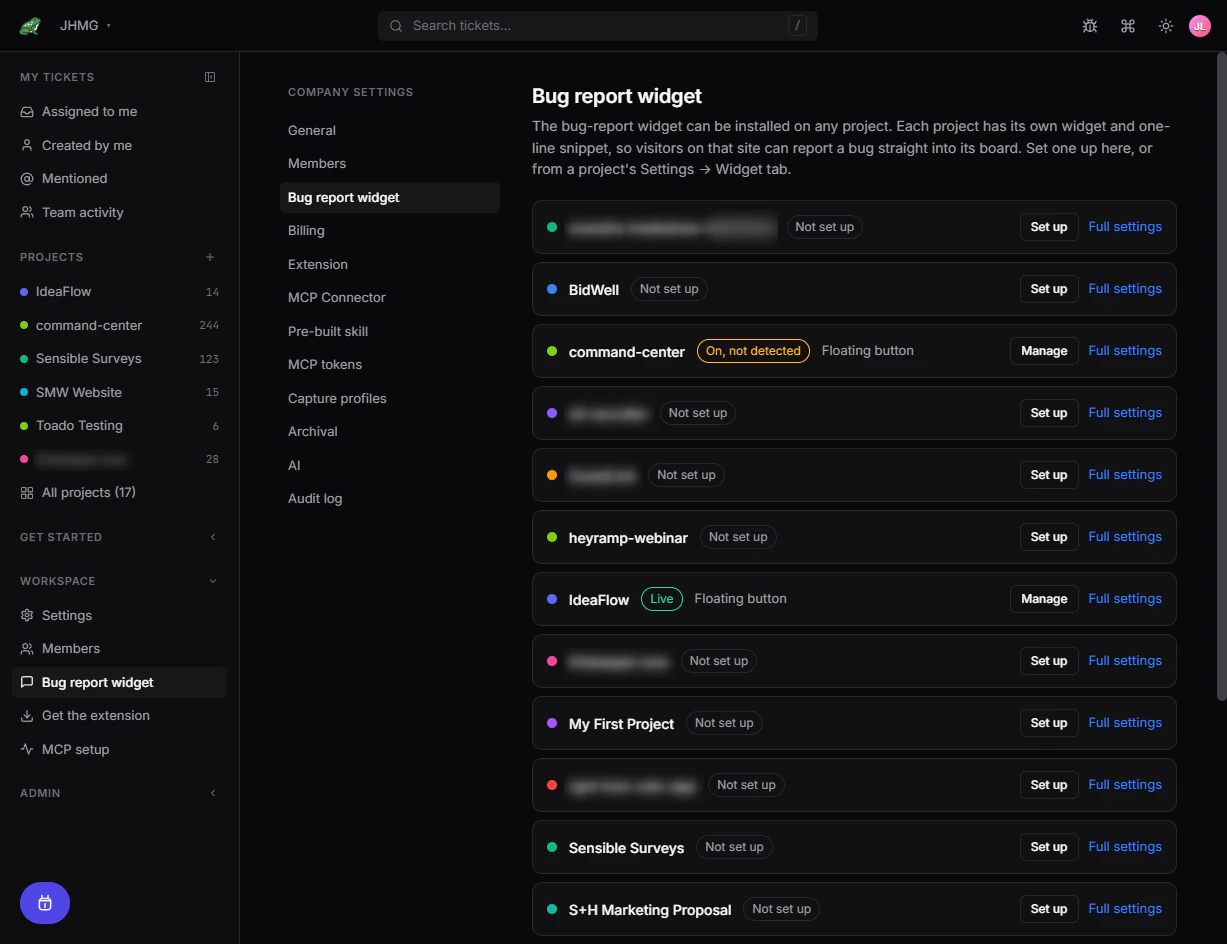
Company Settings → Bug report widget shows every project and its status: Not set up, Off, On, not detected, or Live. Use it to review or begin setup across several products.
Project Settings carries a Widget group in its left nav with four pages: Install, Appearance, Capture, and Security. They are one settings surface split into four, so unsaved changes on any of them are published by the same Save changes bar.
Bug intake sits in the same group and decides which column reports land in. See Bug intake.
Install your first widget
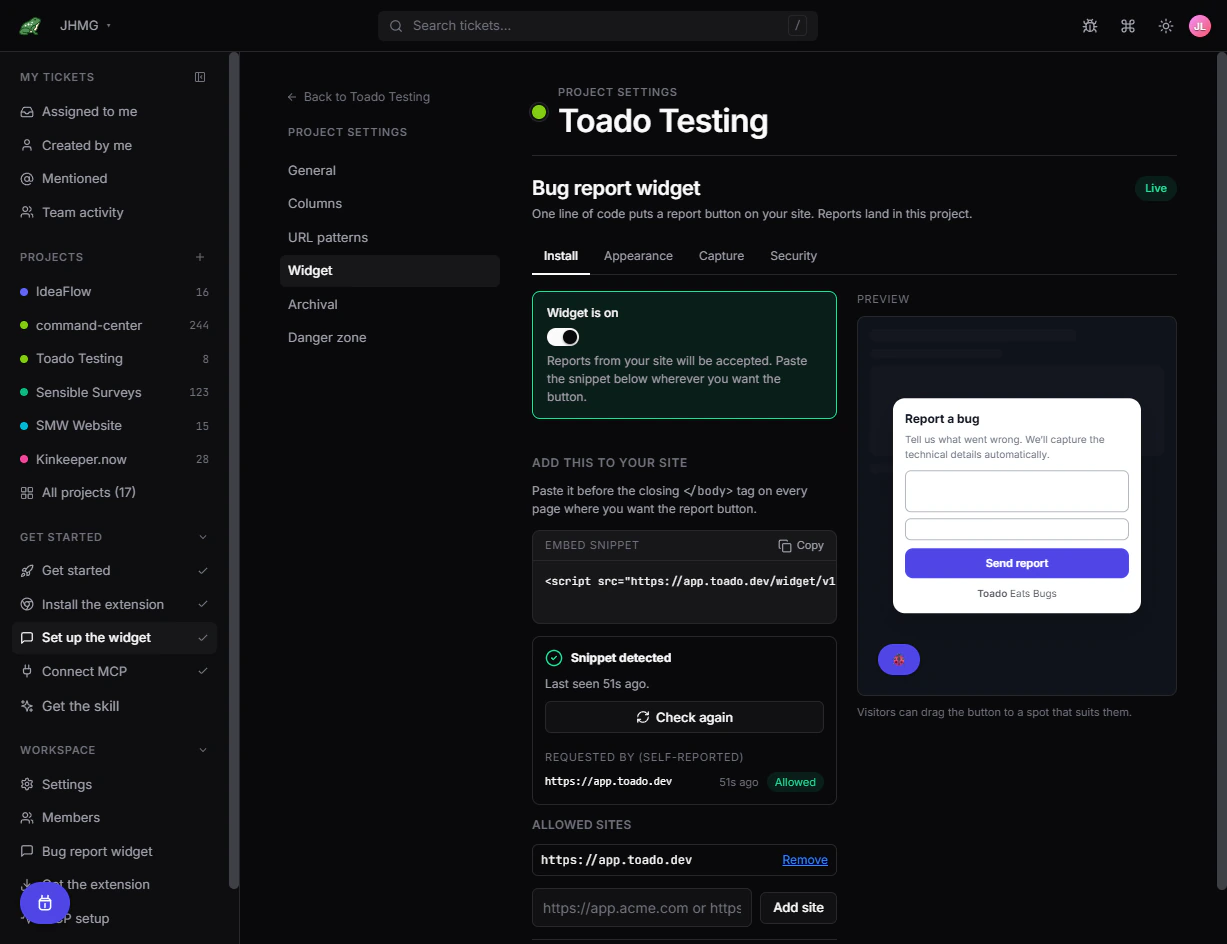
- Open the project that should receive reports.
- Go to Project Settings → Widget → Install.
- Turn on Widget is on and select Save changes.
- Copy the complete snippet under Add this to your site.
- Paste it before the closing
</body>tag on every page where the launcher should appear. - Deploy, then open a deployed page containing the snippet.
- Return to Install and select Verify installation (it reads Check again once a sighting has been recorded). The panel shows Snippet detected or Not detected yet.
- Under Requested by (self-reported), find the origin you recognise, select Allow this site, then Save changes. Until the first site is allowed, the widget is in learning mode and accepts reports from any site holding the key.
- Reload the site and submit a test report.
- Confirm the ticket appears in the selected project with the expected screenshot and evidence.
Copy the script exactly as Toado displays it. The loader address and key are generated for the current environment. Do not reuse another project’s snippet. This nonfunctional example shows only its shape:
<!-- Copy the real value from Project Settings → Widget. --><script src="TOADO_WIDGET_LOADER" data-toado-key="YOUR_PROJECT_WIDGET_KEY" async></script>What reporters see
A reporter opens the launcher, describes the problem, supplies configured contact information, answers custom questions, and submits. The reporter does not gain access to the Toado project. Toado confirms the report when it is accepted; the confirmation wording is fixed and is not configurable in Widget Studio.
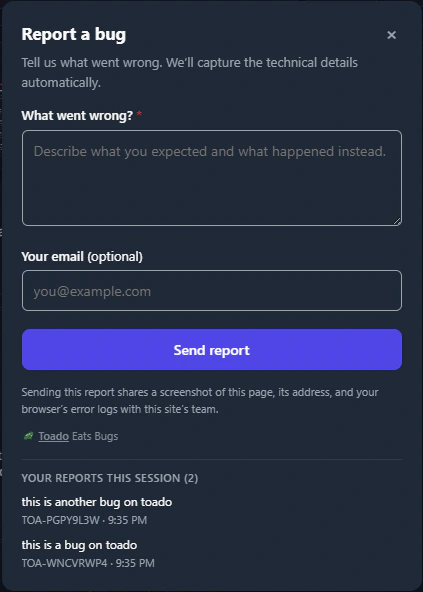
After a report is accepted, the dialog shows its reference for follow-up. Reports submitted in the current browser session also appear under Your reports this session, so the reporter can see what they already sent without gaining access to the project.
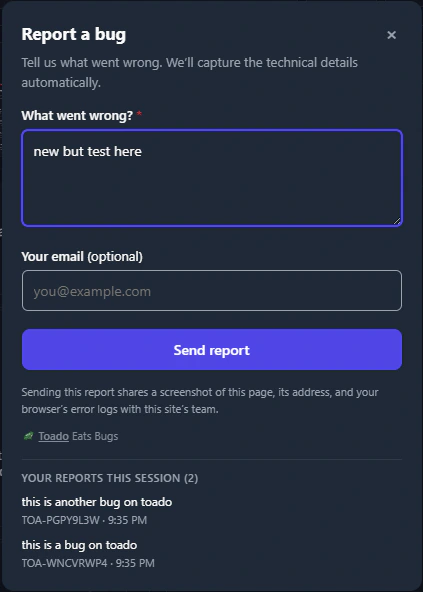
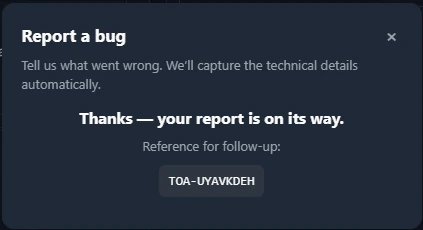
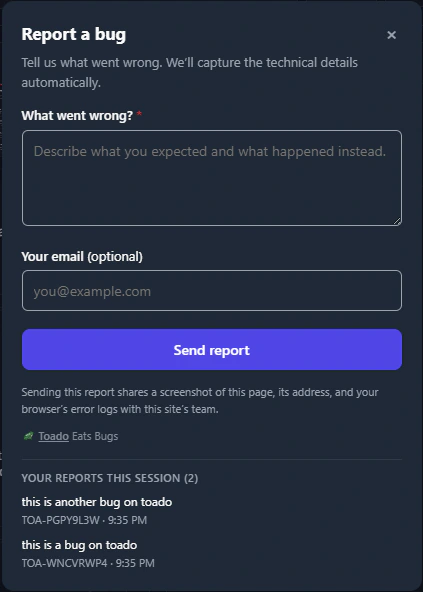
The resulting ready ticket appears on the destination board, in the Bug intake column when that is switched on for the project. Use the board’s From customers quick filter to isolate widget and report-link submissions.
What the team receives
Depending on capture level, a report can include:
- Description, optional reporter identity, and custom answers.
- A DOM-rendered screenshot with widget UI removed and form-field contents masked.
- Page address, the reporter browser string, viewport size, and device pixel ratio.
- Console messages, JavaScript errors, and network request timings in Standard capture.
- HTTP status codes and redacted request bodies in Deep capture.
- A source badge identifying Widget, Report link, or Team snippet provenance.
A reporter name or email is shown on the ticket with an unverified tag, because nothing confirms it: there is no email round trip. The ticket’s title is a placeholder at first and is filled in shortly afterwards when AI titles are enabled for the workspace.
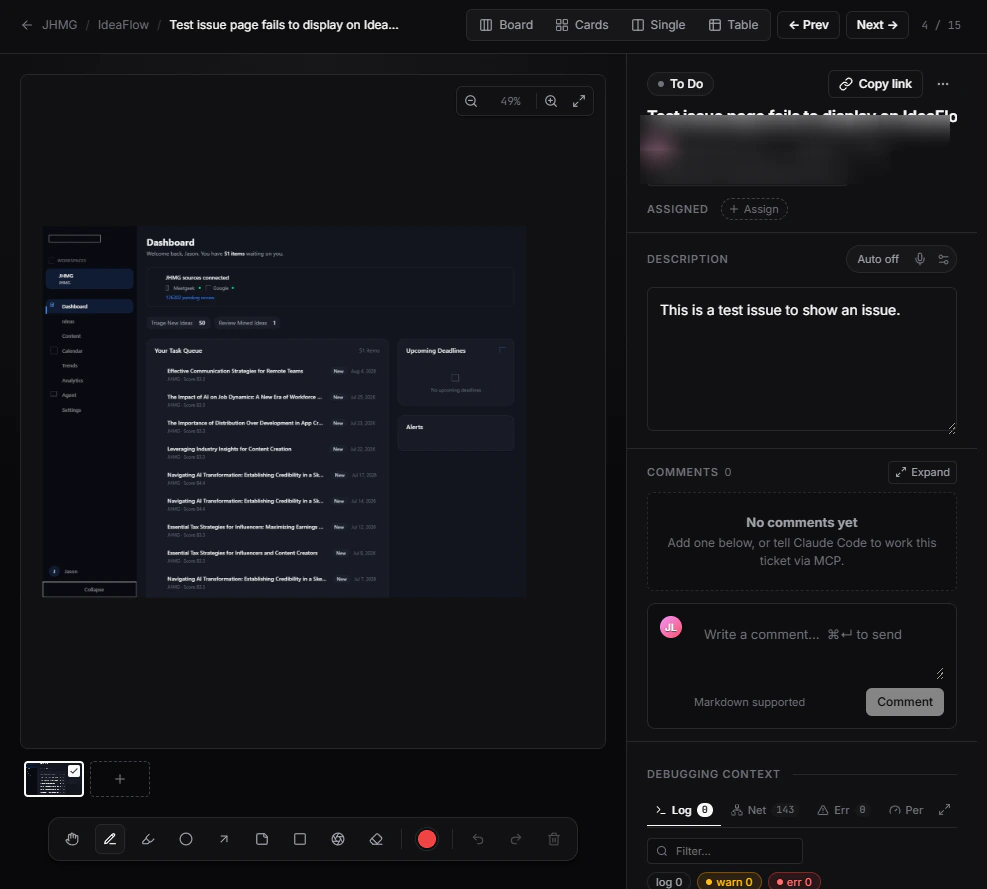
Screenshots are of the viewport only and can be partial: cross-origin iframes, video, WebGL, and canvas render blank, and an image renders only when it is a data URI. See Widget capture.
Test before broad rollout
- Install on staging or an internal route.
- Test mouse, touch, keyboard, and the smallest supported mobile width.
- Submit after producing a known harmless console error.
- Confirm the screenshot excludes the widget and masks form fields.
- Inspect Console, Errors, and Network evidence.
- Test login, checkout, bot protection, and sensitive flows, especially with Deep capture.
- Confirm required fields behave as configured.
- Expand to production only after these checks pass.